# Debugging
# UniWebView Logger
UniWebView could provide detail logs. It helps you to understand what happens in UniWebView.
There are 5 log levels, following the order of verbosity, they are:
- Verbose: The most detailed logging level. It prints out almost all events.
- Debug: Good for the general debugging purpose. It prints most of the events.
- Info: Fewer logs than Debug level, but will cover quite a few important events.
- Critical: This is the default value of the built-in logger. It only prints out error messages you need to notice.
- Off: Turning off the logger.
UniWebViewLogger class takes the responsibility to print log out to console on all platforms. You can set the log level by the code below:
// Set the log level to Verbose
UniWebViewLogger.Instance.LogLevel = UniWebViewLogger.Level.Verbose;
The log message from UniWebView will start with a tag for each platform: <UniWebView>, <UniWebView-iOS>, <UniWebView-Android>, <UniWebView-macOS>. It would be helpful if you want to search in your logs.
For more information on UniWebViewLogger, please refer to its documentation.
# Inspecting Web Page
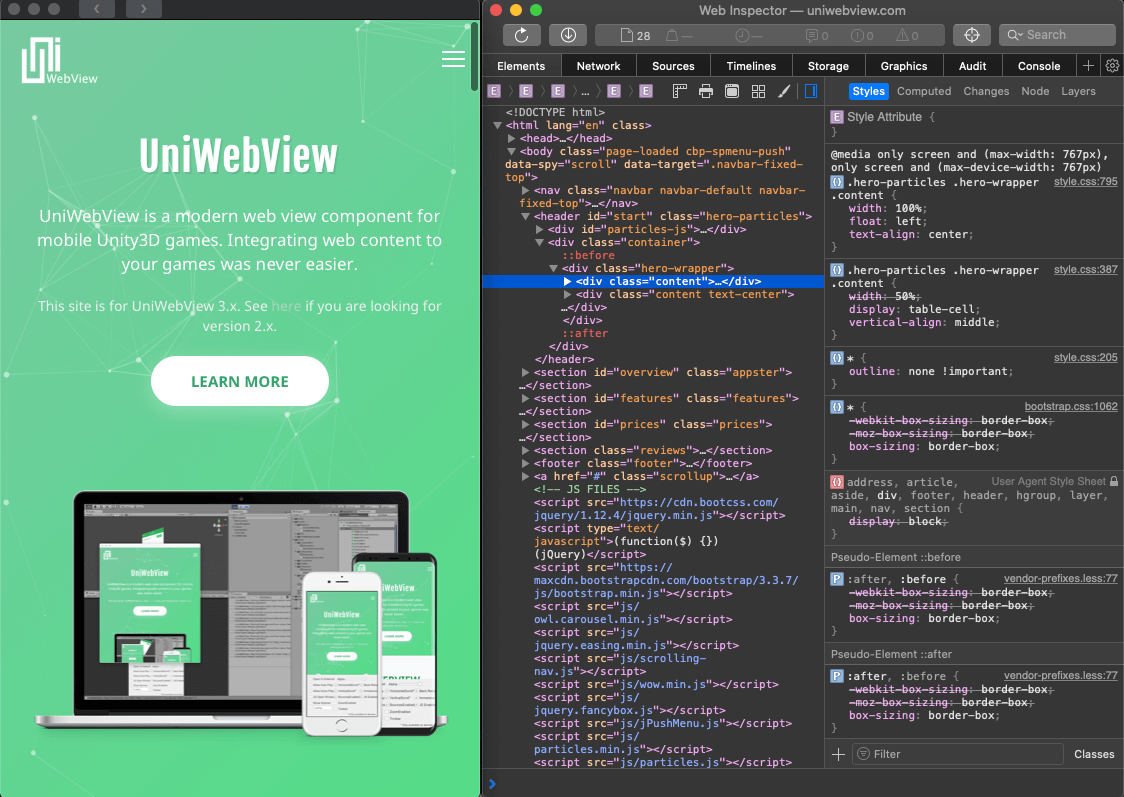
Sometimes, you need to inspect your web page, to modify some DOMs, stylesheets, or watching result of a JavaScript. UniWebView supports to inspect your page in a browser dev tool in Chrome or Safari.
# iOS
There is no additional step for inspecting pages on iOS. You could just run and show your web page in UniWebView on an iOS device or simulator, then follow the Safari Web Inspector Guide (opens new window) to set up your inspector.
# Android
On Android, you need to call the SetWebContentsDebuggingEnabled method first. It will allow Chrome to discover and connect to the web view on Android. Follow the Remote Debugging WebViews (opens new window) topic to know how to use Chrome DevTools with UniWebView.
# macOS
On macOS you need to call the SetWebContentsDebuggingEnabled method first. Then you are able to right click on the web view in macOS editor to bring up the context menu. Select the "Inspect Element" in that menu.

WARNING
Due to a memory bug under WebKit and Unity, it might crash your macOS Editor when you stop playing with an inspector showing embedded in a web view. To avoid this, close the inspector first or use it as a standalone window. This issue only happens in the editor and never affect real devices. Please remember to not enable the SetWebContentsDebuggingEnabled in your product build. This feature should be only used in development.
← WebRTC Support FAQ →